
(Source:as below image)
(To celebrate the achievement of another,)
(To celebrate the achievement of another,)
Information Graphics is an accurate way of displaying information or data through a concise graphical representation. In layman parlance, “Infographics” is every symbol or flow of symbols that convey a meaning through an idea rather than language. Infographics once shared a common heritage with language when the Hieroglyphics were considered pictorial representations and not meaningful words. Infographics is currently being applied to the decoding of the symbolic language of the ancient Indus valley civilization.
From these primeval beginnings almost lost in the mists of time, Infographics continues to play a vital role in several modern applications. Infographics retains an edge due to its ability to get ingrained faster and longer into the human brain. Infographics provides direct instructions cutting through the verboseness of the language I type. The application of Infographics that I think is really cool is in the field of Man Machine interface. Think I, Robot.

(Source: blog of Scott Sheppard: "http://labs.blogs.com/its_alive_in_the_lab/2008/05/index.html")
The interface between humans and the AI in a computer gets more and more complex every time Microsoft brings a new OS out. Yet the primary computer language remains Boolean expressed in the forms of 0’s and 1’s. As more and more people seek access to computers for more complex tasks a certain amount of programming control is handed over to the user. A simple example can be seen from the MS OS. The early generation Windows 98 had very few plugins, if any. Most plugins could only be activated by using the complicated MS-DOS shell. The ability to configure the system, either its hardware or software was limited at best. Compare that to the Windows 7 or if you can imagine, the future Windows 8. The possibility and intricacies appear limitless and therein lays a flaw in the system.
Computer programming is based on choices the user makes. In a way it is governed by the Heisenberg uncertainty principle. As the number of options grow large the effectiveness/hardiness of the program decreases and this leads to increase chances of malfunction. In common speak computers become smart enough to interpret inputs in ways they were not intended to. Consider a complicated software that flies a personal air vehicle (refer Post on PAV’s here). An error could be disastrous. Neither could the program be simplified to give greater power to the human operator because he/she might want to know as little about flying as I do about Justin Bieber. So we enter the crunch paradox where over simplification or complication can lead to disaster. The only way out is a radical change in the system of programming.


(Source:www.nasa.gov; heuristic based graphical coding)
(Source:www.javaworld.com; command based graphical coding)
Unlike Graphical User interfaces (GUI’s) which display a pictorial work desk but maintains a Boolean computer language, Infographics can reach out to both the user and a computer mainframe because in essence it is symbolic logic. Computer algorithms have historically been described as sequential steps which execute a logic function but another effective and efficient way to represent algorithms is a flow chart. Flow charts contain symbols with meaning. If you work the Boolean command under the overall architecture of a flow chart you create symbolic programming instead of Object oriented programming. OOPs creates a multitude of objects varying types and functions but symbolic programming concerns itself with just two absolutes; an information or algorithm and the sequence of graphics that represent it. So rather than having the user and computer in two different pages, with the user barraging a stream of orders, unaware of what the computer is going through, by working through a sequence of Infographics he remains an equal player in grasping the notion of what’s going on.
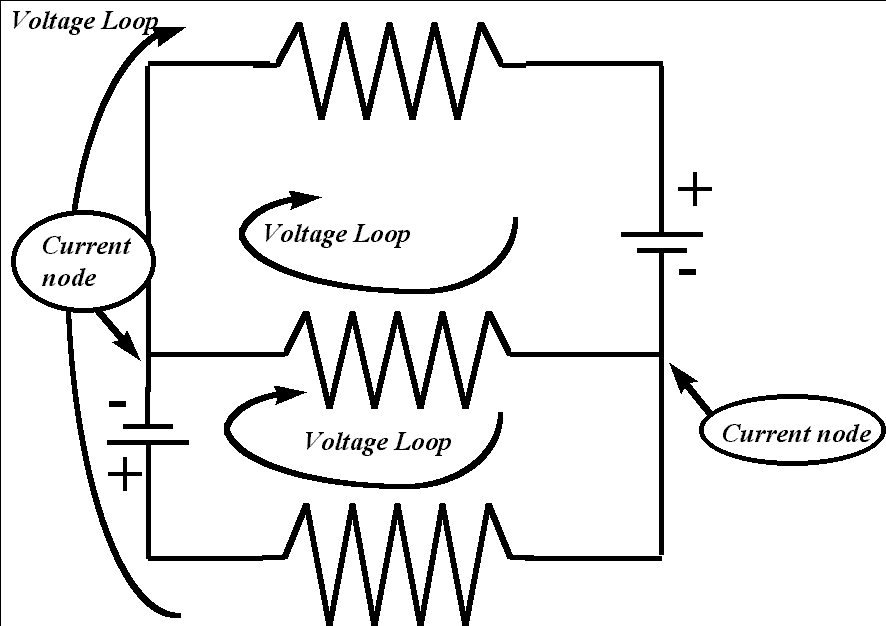
(Source:www.math.ucdavis.edu; Electric circuit example of infographic representation )
Infographics has already found a hardware application in the form of different network topologies. In a way akin to how the invention of math made calculations child play, the application of Infographics have allowed net-workers to create networks of unparalleled complexity and power. Its application in the realm of electricity has yielded electric and logic circuits that power some of the best super computers in the world.
Neatly put, Infographics brings the best out of math and logic. It uses a little known but very powerful part of our brain that strongly identifies with symbols. It allows us to reduce noise in transmission of ideas be it through programs or diagrams. While being hard and resilient to anomalies it retains the flexibility to add branching pathways of newer ideas, information or options. I wonder if you could put this post up as an Infographic.


